Each month, Datavations will be surfacing the most notable shifts happening across building materials and home improvement — what’s rising, what’s falling, and where suppliers and distributors should be paying close attention. Using SKU-level data from our platform, we highlight categories experiencing the biggest changes in revenue, pricing, stockouts, and SKU counts.
Here’s what the market looked like this month:
Revenue Movers
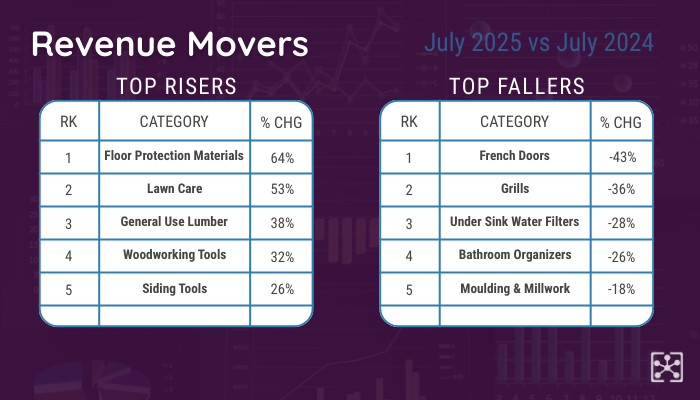
This month’s revenue snapshot highlights both robust growth and steep declines across key categories. Floor Protection Materials surged by 64%, a sign that jobsite demand in construction and remodeling remains healthy. Lawn Care followed closely with a 53% increase, proving that the warm-weather season is stretching its influence further into the calendar. General Use Lumber climbed 38% despite ongoing pricing volatility, while Woodworking Tools (up 32%) benefitted from a mix of professional demand and DIY’er enthusiasm. Rounding out the risers, Siding Tools posted a 26% gain, reflecting strong interest in exterior upgrades or a rising need for exterior repairs.
On the flip side, several categories experienced sharp pullbacks. French Doors fell 43%, reflecting a continuous decline over the last two years. Grills tumbled 36%, which seems to be a common trend for many large, discretionary purchases. Under Sink Water Filters dropped 28% as consumers re-evaluated home upgrade priorities, while Bathroom Organizers slipped 26% as storage demand softened. Finally, Moulding & Millwork declined by 18%, continuing its streak as a consistent laggard.
Executive Takeaway: Growth in seasonal and project-driven categories is strong, but categories tied to discretionary upgrades are showing clear weakness.
Price Shifts

Pricing shifts told a story of rising costs in some areas and heavy discounting in others. Concrete Tools led with a 23% price jump, followed closely by Woodworking Tools at 20% — both suggest suppliers are feeling the squeeze from higher input costs and looming tariff pressures. Floor Protection Materials climbed 14%, mirroring its revenue gains, while Power Tool Kits and Electrical Testers each rose by 12%, reinforcing their position as indispensable categories with pricing power.
Yet, not all categories could hold the line. Showers & Doors dropped by 23% in average sale price, joined by Under Sink Water Filters at -20%. Both may be signs of oversupply or possibly aggressive promotion. Despite the pricing drop, Under Sink Water Filters was still hit by a drop in revenue as well. Ceiling Grids (-19%) and Moulding & Millwork (-13%) faced steady downward pressure, while Lawn Care saw a 13% decline in price despite its revenue growth. This is clear evidence that competitive pricing is fueling unit volume at the expense of margins.
Executive Takeaway: Price increases are sticking in pro-driven categories, while consumer-focused categories are relying on discounts to drive sales.
Stockout Losses
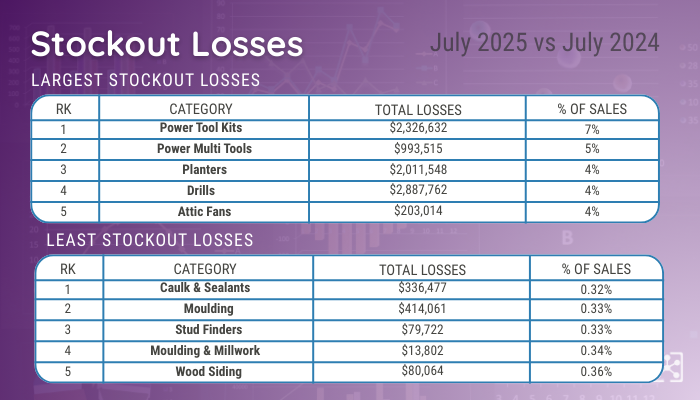
Stockouts continue to erode sales, with high-value categories losing millions. Power Tool Kits alone suffered $2.3 million in missed revenue, equating to 7% of category sales. Drills topped the list in absolute terms, with nearly $2.9 million lost (4% of sales). Planters weren’t far behind, costing suppliers $2.0 million in missed opportunities. These categories prove that strong demand is meaningless without available inventory.
Meanwhile, categories such as Caulk & Sealants and Stud Finders escaped relatively unscathed, each seeing less than 0.4% of sales lost to stockouts. The lesson? Even in strong-performing categories, poor inventory alignment can mean the difference between record growth and millions left on the table.
Executive Takeaway: Demand isn’t the problem — availability is. Stockouts in core categories are leaving millions on the floor. [Read related blog: Don't Miss Your Moment]
SKU Count Changes
.png)
Shifts in SKU counts revealed where retailers are leaning in and where they are pulling back. On the expansion side, Door Knobs grew 23% and Deadbolts rose 20%, highlighting continued investment in security and hardware categories. Roofing Supplies saw a 15% SKU increase, consistent with seasonal resets and weather-related demand.
In contrast, several categories contracted sharply. Marking Tools led the declines with a 36% reduction, followed by Drills, which shed 24% of SKUs, suggesting tighter assortments in core tool categories. French Doors also shrank by 8%, reflecting its revenue declines and a shift away from overextended assortment.
Executive Takeaway: Retailers are expanding in essential, steady-growth categories while pruning back underperforming or saturated ones. This could be pointing to strategies based on tariff volatility and anticipation of upcoming tariff changes.
Why This Matters
For suppliers and distributors, these shifts aren’t just interesting data points. They are signals of real risks and opportunities in a market that is constantly moving.
When prices rise in professional categories like concrete and woodworking tools, it can strengthen margins for suppliers who respond quickly, but leave slower competitors squeezed. On the other hand, categories like showers and filters are often in a price war, and without the right market intelligence, it’s easy to get caught in a race to the bottom.
Stockouts are another silent killer. A few percentage points of missed availability in power tools or planters can amount to millions in lost sales — revenue that competitors are all too happy to capture. The stakes aren’t just about keeping shelves stocked. They’re also about protecting your brand’s share in the categories that drive customer loyalty.
Additionally, retailers are effectively voting with shelf space as assortments continue to shift. Increases in hardware SKUs and roofing supplies point to where they see growth opportunities, while cuts to drills and French doors show where confidence is fading. Understanding these moves early on allows suppliers to get ahead of resets and avoid scrambling after the fact.
The bottom line: Staying ahead of these market shifts requires more than intuition or last quarter’s sales report. It takes SKU-level clarity, tied to specific retailers and locations, to separate the noise from the real opportunities. That’s where Datavations comes in — delivering the insight you need to anticipate change, act decisively, and capture an outsized share of growth before your competitors do.
%20(4).png)
Get the Full Picture
Want the understand more about the “why” behind these moves? Tariffs are rewriting the playbook. Join our live webinar on October 2, 2025 for practical playbooks by category and role. Registration will open in mid September.
This monthly “What’s Up, What’s Down” series shows just a slice of what Datavations tracks across 1000+ categories, 5,600+ brands, and over 400,000 SKUs.
If you're interested in seeing what’s happening in your categories and at your retail partners book a 30-minute demo and we’ll show you the trends that matter most to your business.
Related Links
Blog: Don’t Miss Your Moment – What Seasonal Shifts in Grass Seed Can Teach Us About Retail Strategy
Our Platform
Contact Us
Download a Copy
View and download July's What's Up | What's Down infographic here!