Don’t Miss Your Moment – What Seasonal Shifts in Grass Seed Can Teach Us About Retail Strategy

In the competitive world of building materials and home improvement, sales can be won, or lost, in the details. Success is not solely about how well you perform during the peak season(s). It is about how consistently you are able to capitalize on every opportunity — especially the ones hiding in plain sight. Sometimes it is not the blockbuster seasons or bestsellers that drive your edge, but the overlooked opportunities hiding in off-peak patterns.
At Datavations, we recently conducted a category level analysis of the grass seed market using our platform’s granular SKU and regional data. The intent was to highlight just how critical it is to know where and when your brand has the upper hand—and how easily those advantages can slip through your fingers. While the findings focus on one product category and their two largest players (anonymized as Company A and B for this report), the lessons apply broadly across retail — from fertilizers to flooring, adhesives to drywall.
Spoiler: A smart seasonal play doesn’t mean anything if your shelves are empty when demand peaks. Seasonal precision and regional awareness are not just “nice to haves” anymore. They are million-dollar necessities.
Same Category, Different Seasons, Different Winners
Grass seed may seem like a simple category, but it is loaded with complexity. It is highly seasonal, highly regional, and heavily influenced by climate variation and consumer habits. Each region has its own unique seasonal peaks and valleys which are shown below in Graph 1.
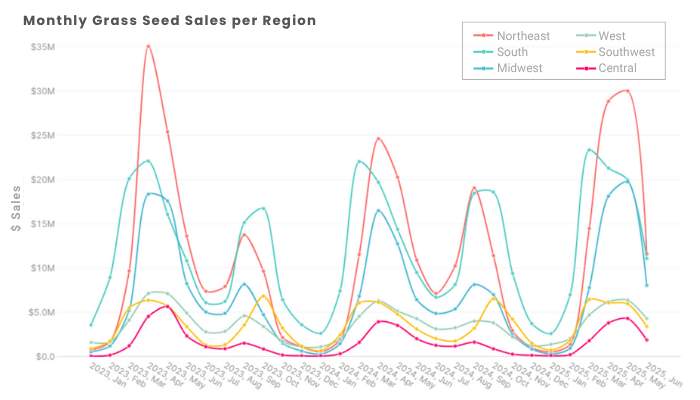
In our analysis, Company A, one of the most widely distributed lawn and garden brands in U.S. home improvement stores, dominates the overall market share—owning roughly 62% of annual sales in this category and spiking above 70% during the peak seasons of spring and summer. This is consistent with what many brands expect: invest in your high season to win big and protect your market share.
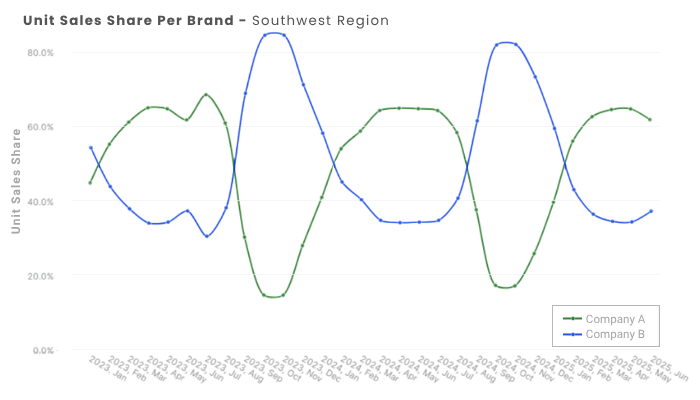
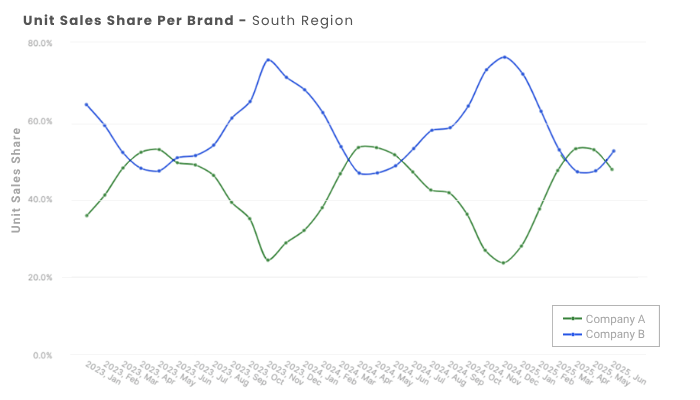
However, our data tells a different story for the winter months. Enter Company B, a well known challenger brand with a specialty product that thrives in colder months. This company quietly leapfrogs Company A, particularly in the South and Southwest, thanks to a niche grass seed product that performs better in these areas at this time of the year, and is often used to provide coverage when warm-season grasses are dormant.
During these off-peak months, Company B temporarily overtakes Company A in unit share, capturing a commanding regional advantage. It is a classic case of the right product, right place, right time and shows how niche products can flip the script seasonally.
But there is a twist. Despite its strategic product edge, Company B is underdelivering on its own opportunity.

Stockouts are Silent Killers
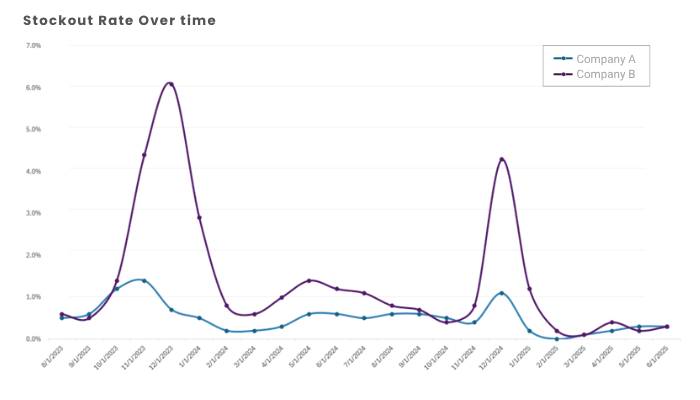
Although Company B clearly has a seasonal advantage and sees a steady regional surge in demand during off-peak months, our data shows that they have been unable to keep its high-demand product in stock when it matters most. In fact, stockout rates during the past two winters in the South and Southwest hit nearly 15% for this SKU alone. This is a shocking figure considering the brand’s dominance in that niche market. As a reference, general retail stockout averages are typically around 8-10% which suggests a clear and costly gap in Company B’s execution.
.png)
The number may seem abstract, but it is not. When projected across key regions, stores, and demand curves, we estimate that these stockouts have cost Company B a staggering $1.5 million in missed revenue over the last two winters alone. This is not a supply chain issue though. It is a visibility issue. This is what happens when brands do not have access to the right data at the right time to inform their seasonal inventory optimization.
Datavations’ platform can flag these patterns so you are not reacting to demand surges — you’re anticipating them.
What This Means for Brands Like Yours & The Power of Knowing Where You Win
The lesson here is not just about grass seed. It is about recognizing when and where your advantage lies and making sure your execution matches that advantage.
Let’s break that down:
- Peak Season ≠ Only Season: Every brand focuses on the big seasonal push but in doing so, many ignore the valuable, and often less competitive, off-peak gains.
- Regional Trends Matter: Inventory planning must be aligned with climate zones, local retailer behaviors, and SKU-level seasonality, especially in categories like lawn care, tools, and adhesives.
- Missed Opportunities Compound: A 2% miss here, a 5% lift there — it adds up! As this case shows, “small” stockout rates can mean millions over time.
- Retailers Notice Gaps: National retailers reward consistency. If your brand cannot deliver during peak and off-peak periods, shelf space and promotional support may shift to your competitors.
Final Thought: Don't Just Play the Game. Win in the Gaps.
The moral of this story, what happened to Company B is avoidable. With smarter inventory forecasting, dynamic assortment strategy, and region-specific insights, they could have maximized their winter win. Instead, they handed $1.5 million back to the market. We are in a time when retail in this space is only becoming more competitive. Your edge in the industry is not just about what you sell, it is when, where, and how well you match your supply to your customers’ demand. The dollars in the details. See them. Scale them. Seize them.
How Datavations Can Help you Stay Ahead
At Datavations, we love empowering brands to detect, quantify, and act on these opportunities before they become a missed chance or lost revenue. Our platform aggregates and analyzes hundreds of millions of inventory, sales, and pricing records across 403,000+ SKUs, 5600+ brands, and 1000+ categories in the building materials and home improvement space. With Datavations, brands can:
- Identify SKU-level regional trends before they become problems
- Benchmark stockout rates across competitors
- Optimize seasonal inventory allocation
- Adjust pricing strategies based on performance and shelf dynamics
- Pinpoint when and where to lean into your niche strengths
In short: we help you stop leaving money — and sales opportunities — on the table.
Want to know where you are leaving sales behind? Book a demo today to see the data in action.